Debuggers and REPL (Interactive prompt / intepreter) are invaluable development tools. They serve mostly complimentary functions.
A Debugger is most useful to run a program and inspect program state in between. In contrast, an REPL is most useful to try out standard library functions when developing, and try out your own functions too without needing to establish an end-to-end flow (such as an API endpoint or a subcommand). It’s especially useful when your functions have complex inputs or outputs, since it allows to express them in the syntax of the host programming language.
I have been programming in Python since a while, and IntelliJ PyCharm and VSCode are the two prominent IDEs for Python. IntelliJ has a nice feature called “Python Console” which is an layer over standard Python REPL. It will provide IntelliJ’s completions when typing into the REPL, and let’s you drop into the debugger and stop at the breakpoints by calling a function from the REPL.
It also shows the variable inspector (just like a debugger) on the right side of the console.
So far I have not been able to find an equivalent in VSCode. I tried to come up with something using the VSCode Debugger.
The idea is very simple in hindsight - to run the IPython module as the entrypoint for the debugger, with all the configuration, such as .env files1.
Here’s what a launch.json for launching IPython looks like - very straightforward.
{
    // Use IntelliSense to learn about possible attributes.
    // Hover to view descriptions of existing attributes.
    // For more information, visit: https://go.microsoft.com/fwlink/?linkid=830387
    "version": "0.2.0",
    "configurations": [
        {
            "name": "IPython",
            "type": "debugpy",
            "request": "launch",
            "module": "IPython",
            "console": "integratedTerminal",
            "env": {
                "SOME_VARIABLE": "VALUE"
            },
            "envFile": "${workspaceFolder}/.env",
        },
    ]
}
We make sure to use IntegratedTerminal as console type so that we can type into the IPython prompt. In other cases (such as debugging a server application), internalConsole is usually better.
With this we can actually start the IPython from Run/Debug pain.
I got an AI chatbot to write some dummy code which gets github statistics from the API for the sake of this demonstration.
import requests
from datetime import datetime, timedelta
from pydantic import BaseModel
from typing import List


class RepoStats(BaseModel):
    name: str
    owner: str
    stars: int
    stars_last_month: int
    forks: int
    open_issues: int
    watchers: int
    top_contributors: List[str]


def get_github_repo_stats(owner: str, repo: str) -> RepoStats:
    base_url = f"https://api.github.com/repos/{owner}/{repo}"

    # Get repository details
    repo_response = requests.get(base_url)
    if repo_response.status_code != 200:
        raise Exception(
            f"Error: Unable to fetch repo data (status code: {repo_response.status_code})"
        )

    repo_data = repo_response.json()

    # Get contributors (top 5)
    contributors_url = repo_data.get("contributors_url")
    contributors_response = requests.get(contributors_url)
    contributors = (
        [contributor["login"] for contributor in contributors_response.json()[:5]]
        if contributors_response.status_code == 200
        else []
    )

    # Get stars from the last month
    last_month_date = (datetime.utcnow() - timedelta(days=30)).strftime(
        "%Y-%m-%dT%H:%M:%SZ"
    )
    stars_url = f"https://api.github.com/repos/{owner}/{repo}/stargazers?per_page=100"
    stars_response = requests.get(stars_url)

    stars_last_month = 0
    if stars_response.status_code == 200:
        stars_data = stars_response.json()
        stars_last_month = sum(
            1
            for star in stars_data
            if star.get("starred_at", "1970-01-01T00:00:00Z") > last_month_date
        )

    # Construct response using Pydantic model
    return RepoStats(
        name=repo_data.get("name"),
        owner=repo_data.get("owner", {}).get("login"),
        stars=repo_data.get("stargazers_count"),
        stars_last_month=stars_last_month,
        forks=repo_data.get("forks_count"),
        open_issues=repo_data.get("open_issues_count"),
        watchers=repo_data.get("watchers_count"),
        top_contributors=contributors,
    )
Now let’s say I want to call this function from REPL (because I dont have an API or CLI interface yet) and also stop at some breakpoint.
I have to activate virtual environment and install IPython
python3 -m pip install ipython
I can set the breakpoint in VSCode, and then run the IPython launch/debug configuration just created.
This will actually start the IPython REPL in the Integrated Terminal. Then I can import the file using relative path, and run the function. I have set a breakpoint, which it will hit and stop.
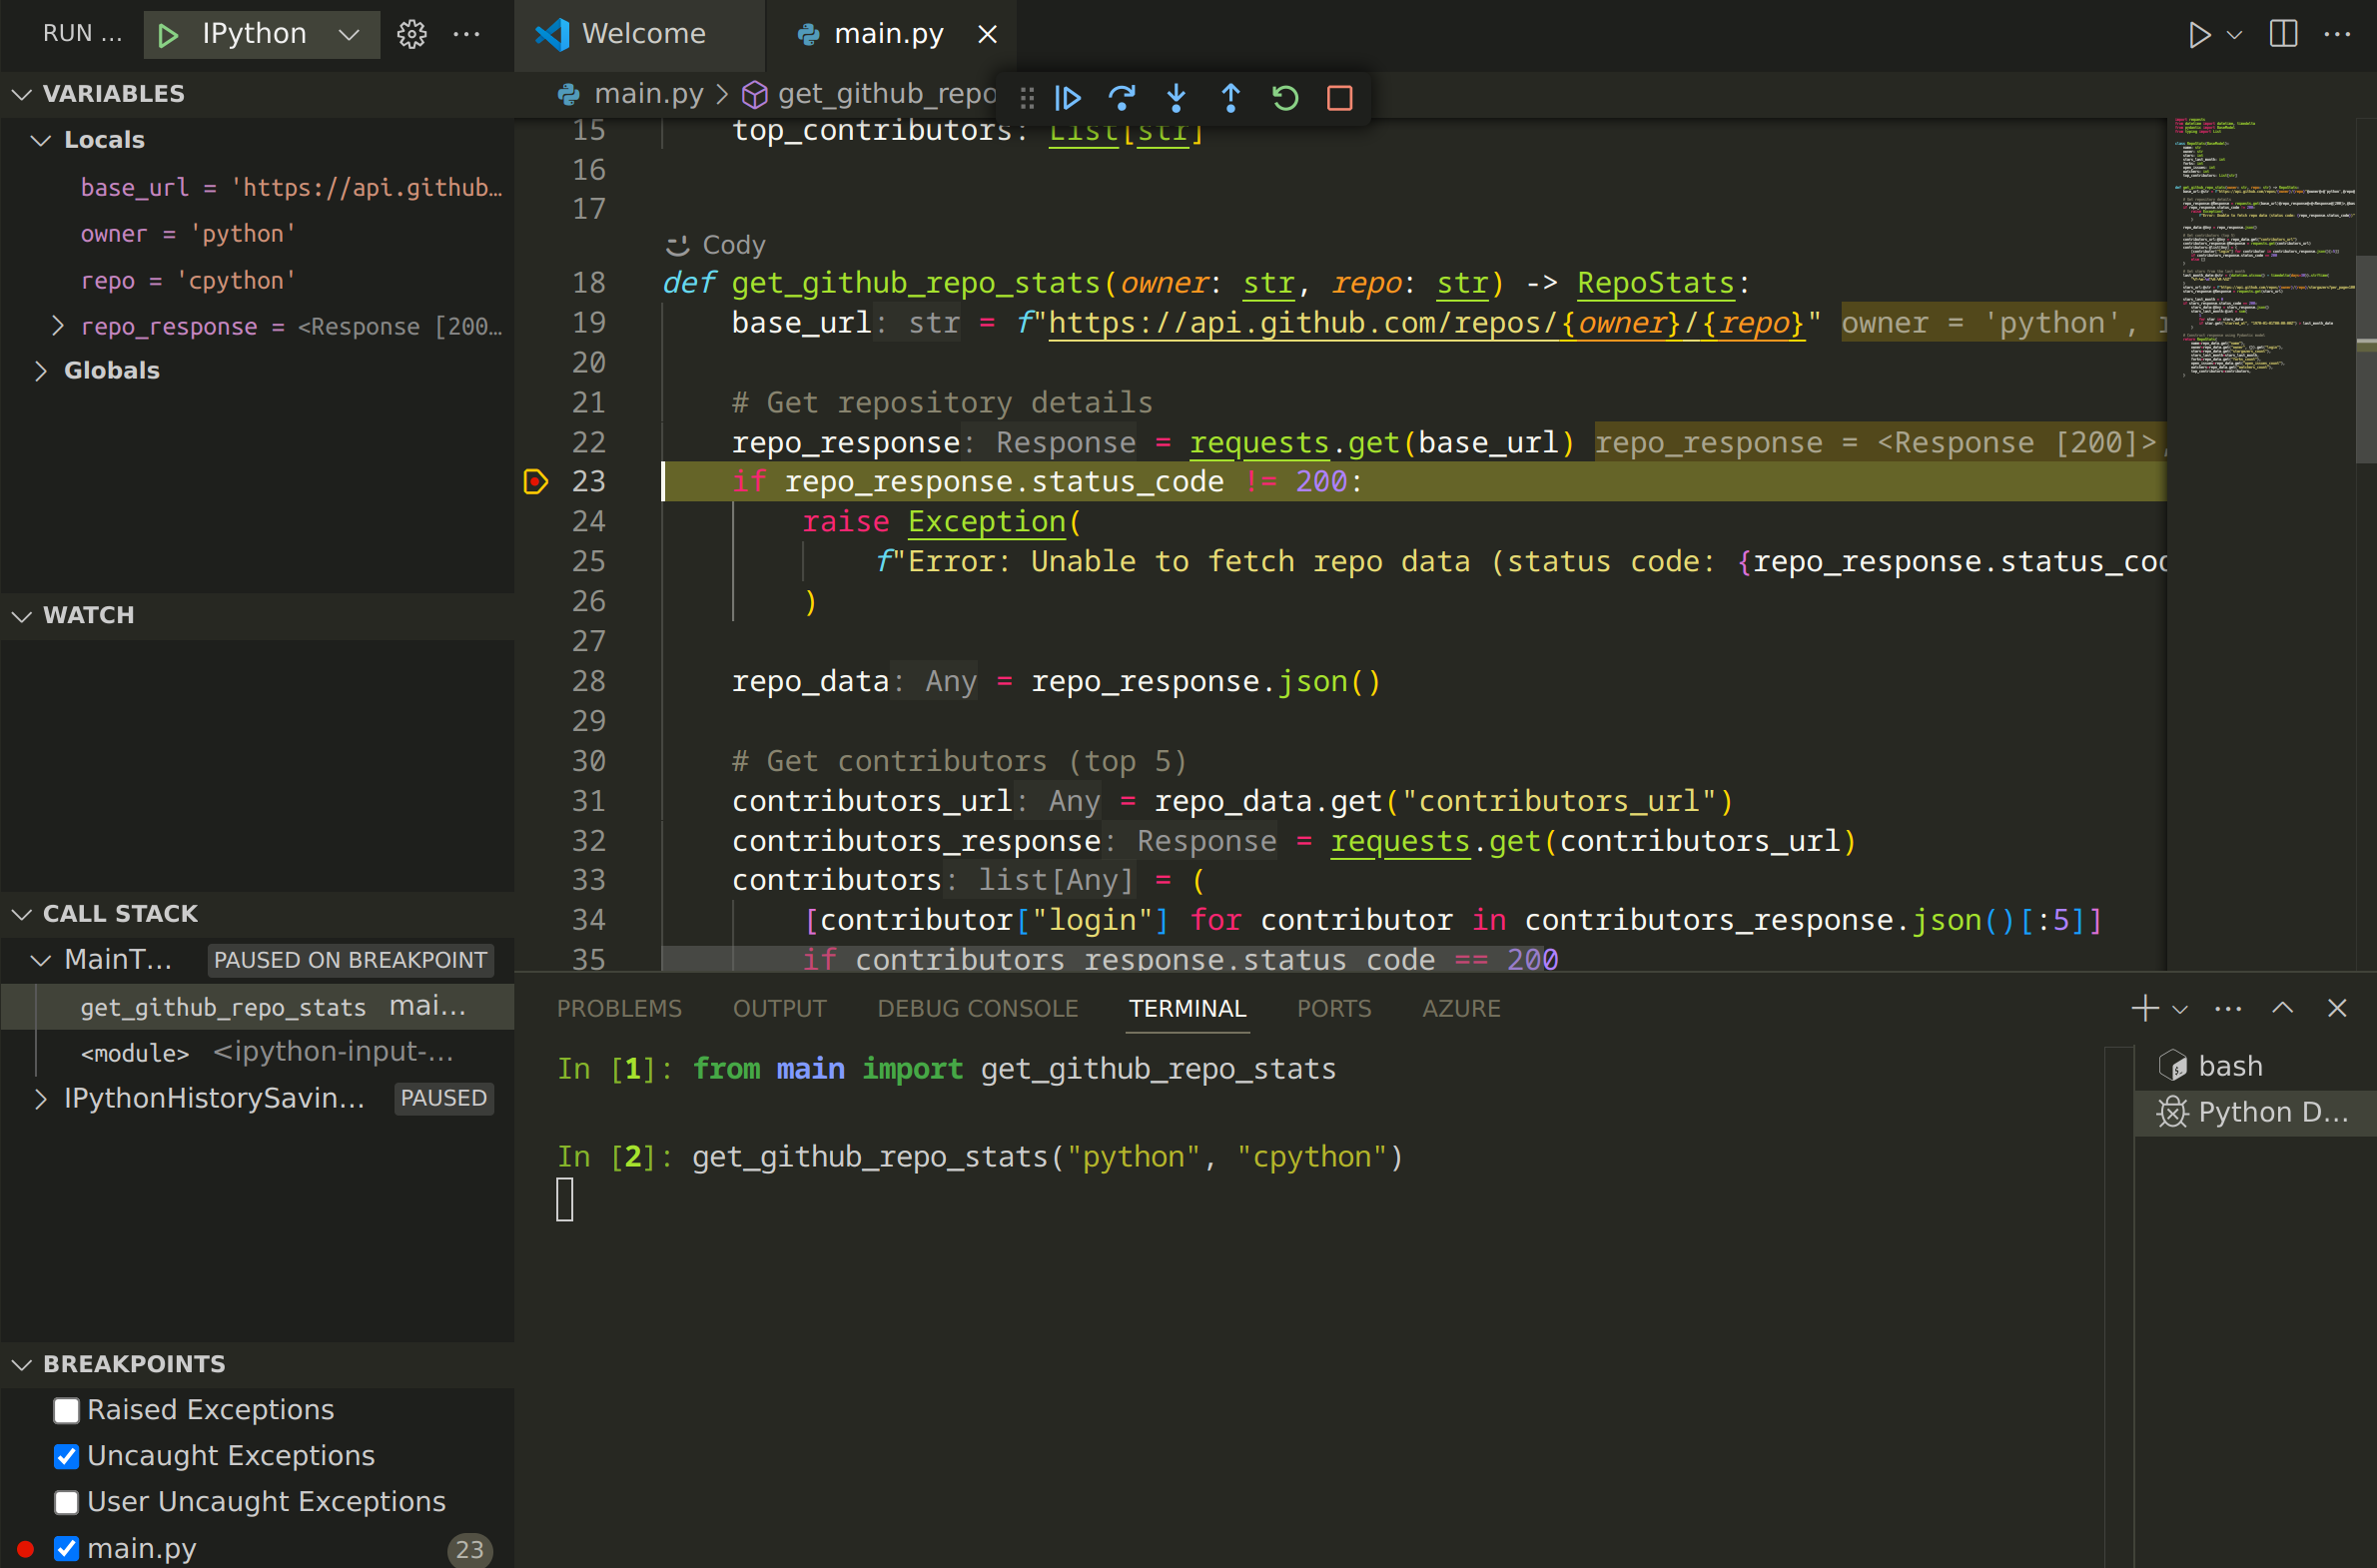
I can see the program state on various panes on the left (variables, watch list, thread / stack state).
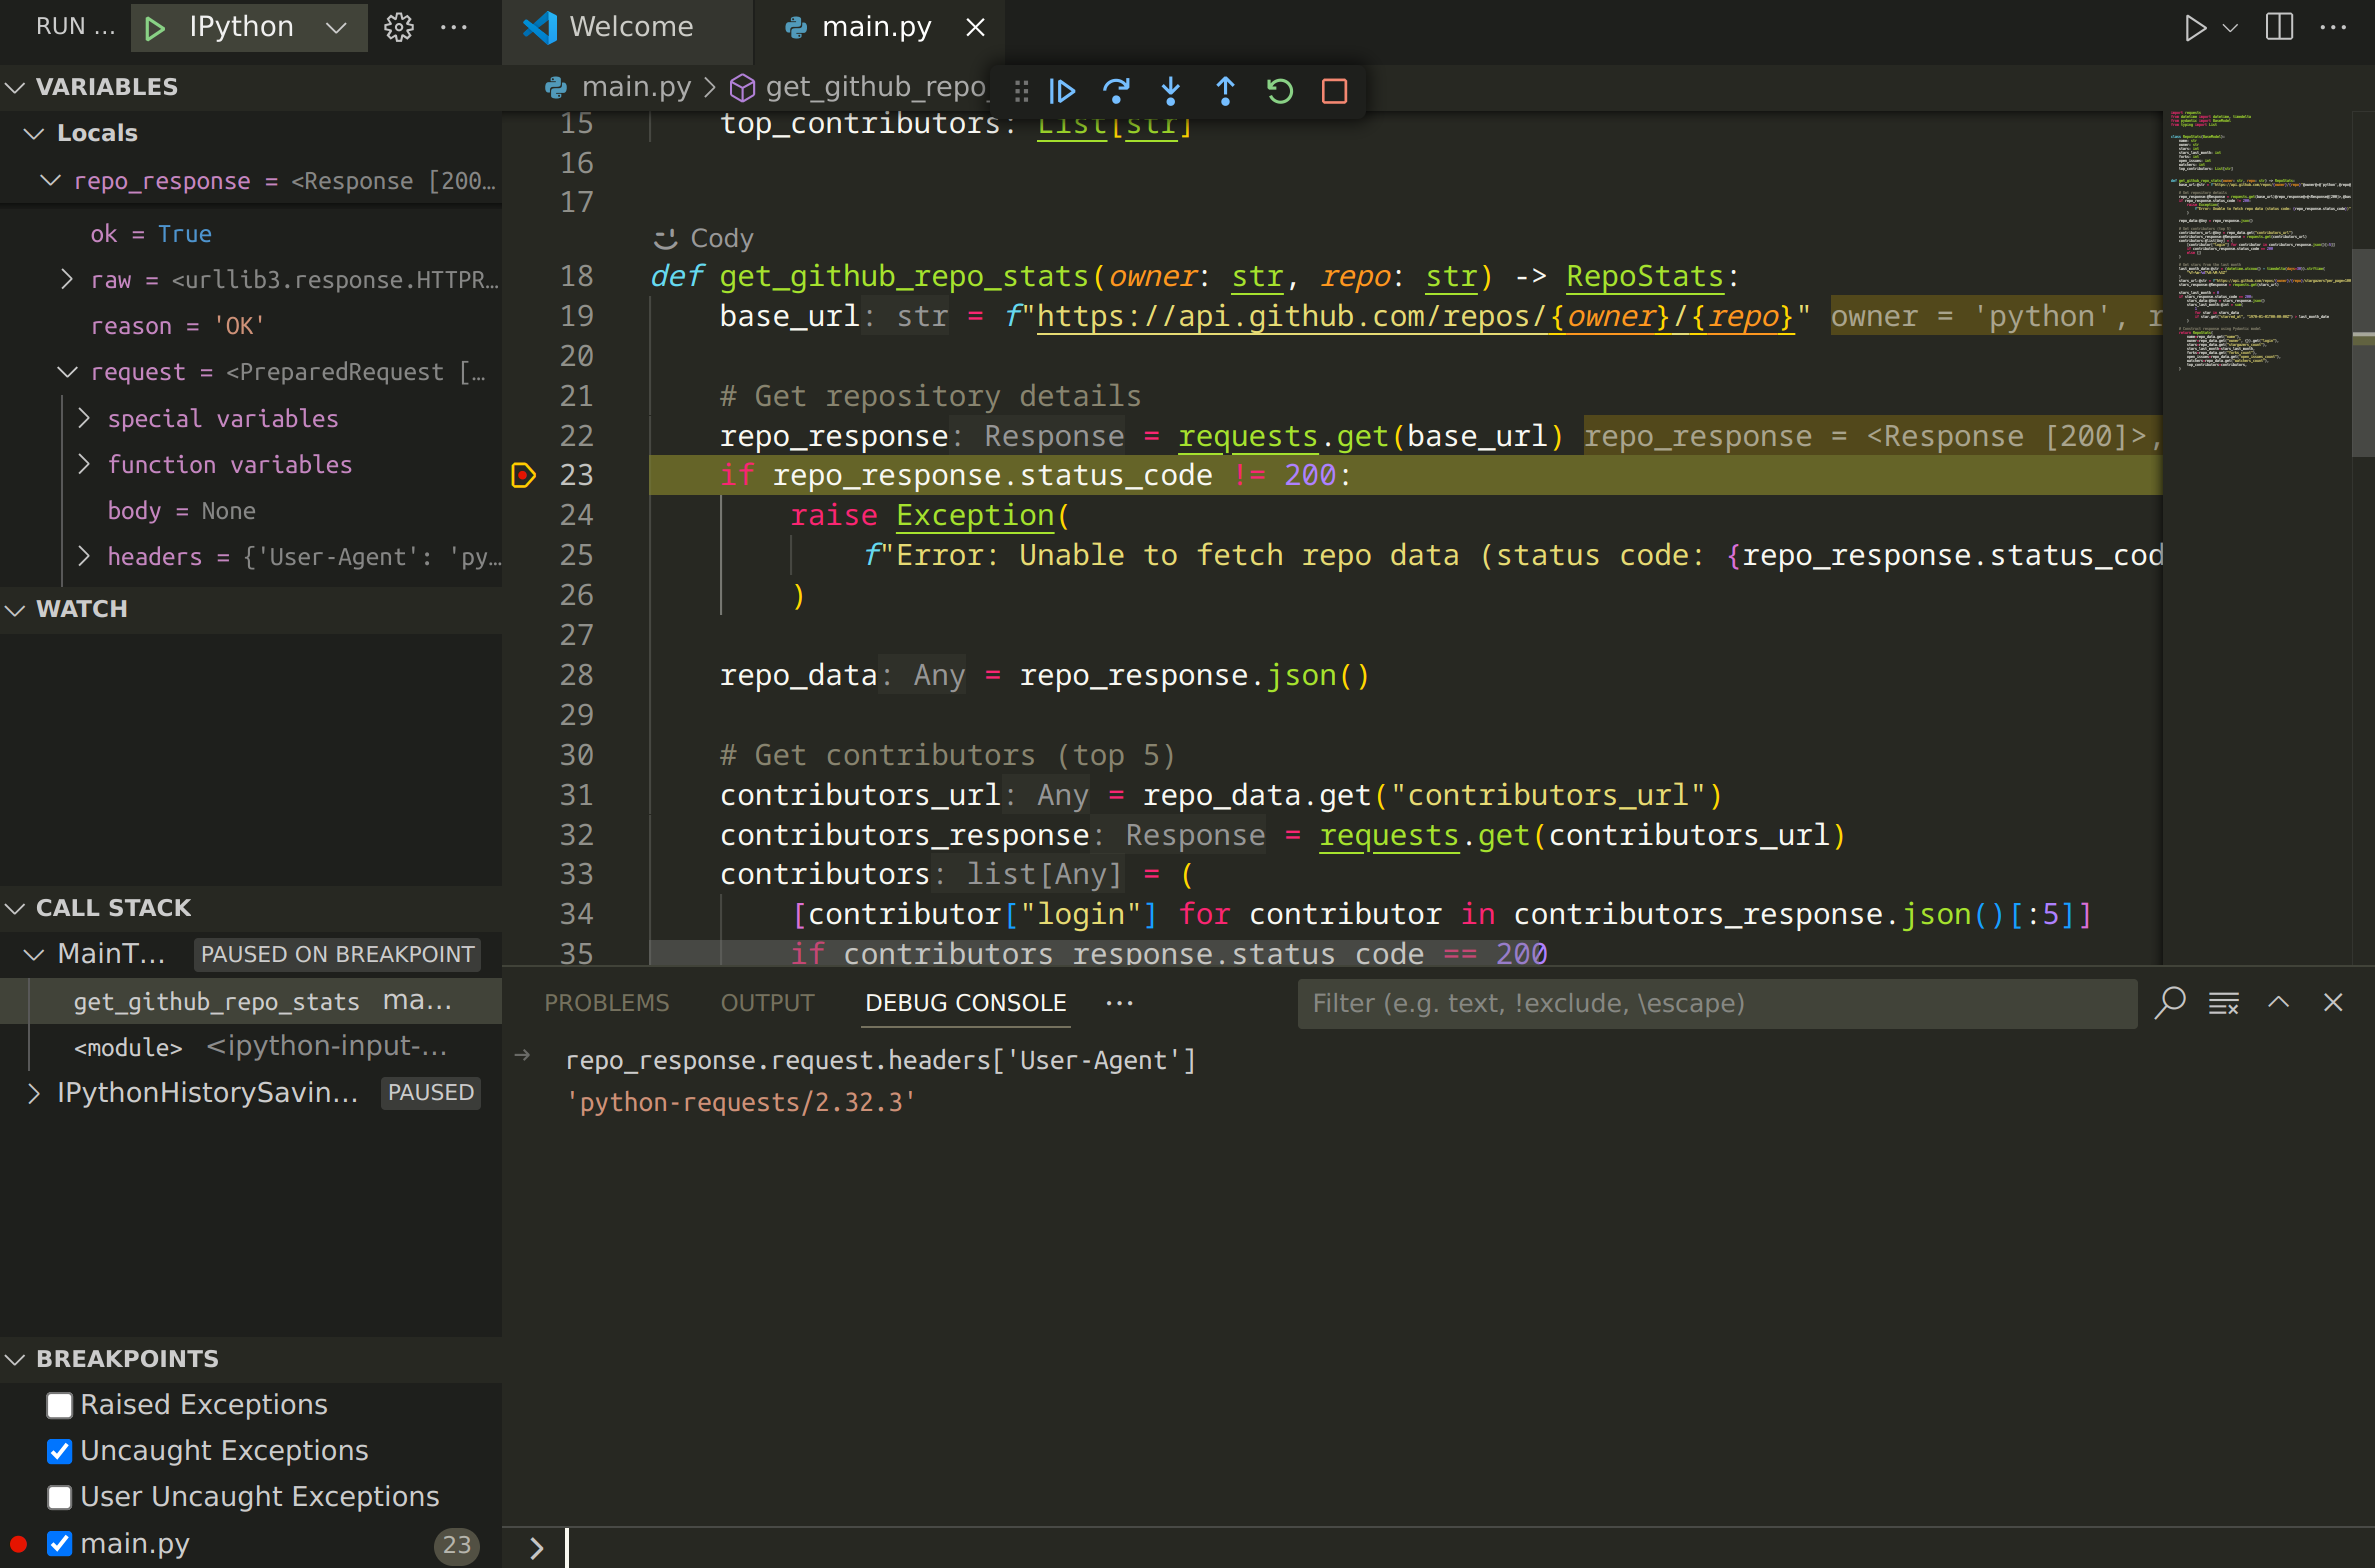
I can also evaluate expressions by switching to debug console, as expected.
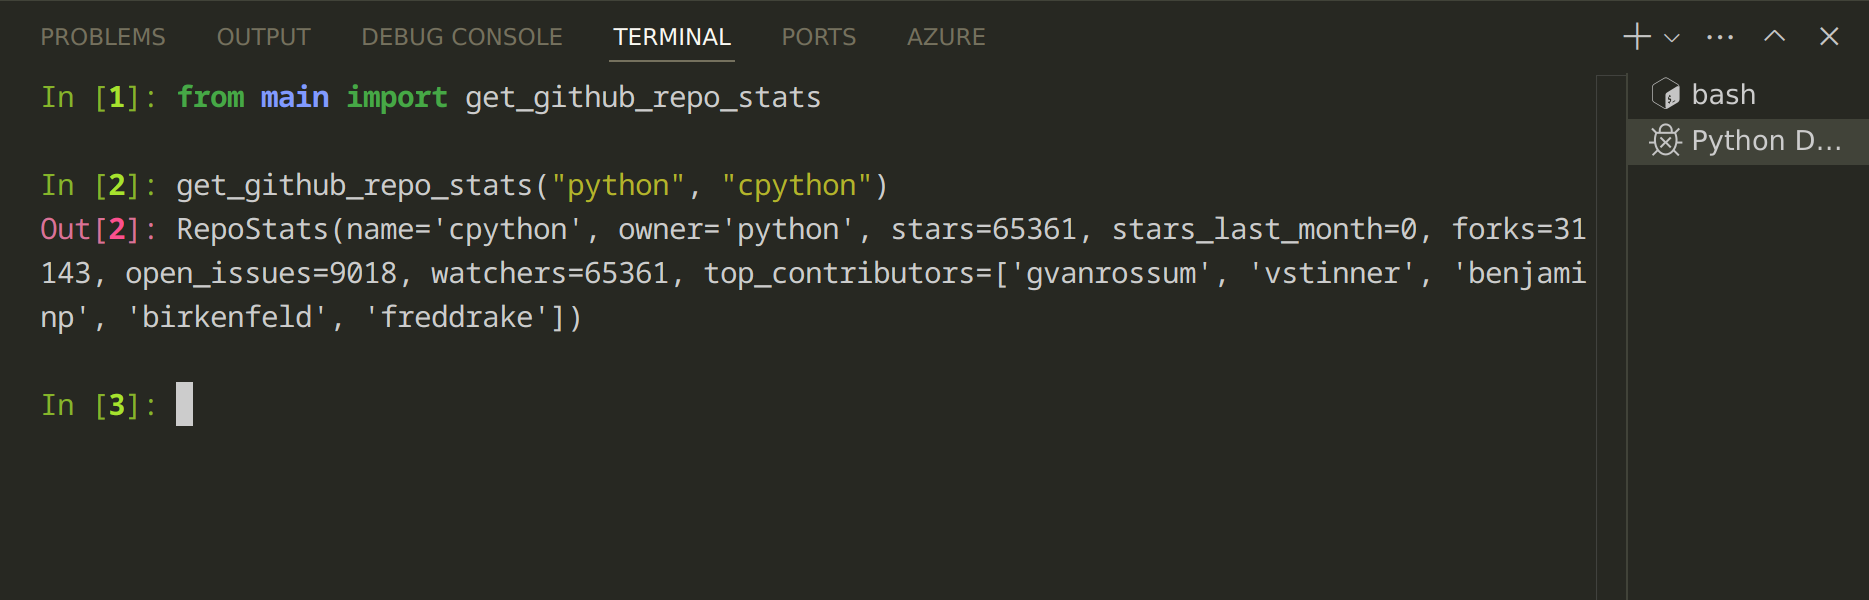
After clicking continue button (or F5), the execution of IPython resumes and I get the result printed as usual.
For Python Debugger, IPython is just another python module, which enables this nice trick.
Actually It appears PyCharm does not support passing a
.envfile to Python Console. It can be worked around by opening the environment variables config and copy-pasting the contents of the.envfile, which it’s able to parse. ↩︎